VSCode, C/C++ and fips
I had a closer look at the VSCode C/C++ plugin yesterday and started to add VSCode support to fips.
Here’s a very short video how it looked like yesterday (this still used the standalone LLDB VSCode plugin, I have switched now to the debugger integration from the standard C/C++ plugin):
YouTube work-in-progress video
Right now this is all very work-in-progress and only works on OSX, but I used this setup all day today at work and it’s already pretty nice! Maybe not yet Visual-Studio-2015-nice, but overall at least as nice as Xcode or QtCreator, (some would say that’s not a big achievement though ;)
Here’s how using VSCode with fips works for the user, this selects a VSCode build config, generates the project files via cmake, and opens VSCode:
> ./fips set config osx-vscode-debug
> ./fips gen
> ./fips open
There are a couple of new build configs (e.g. osx-vscode-debug), the build config file contains the information that VSCode should be used as ‘build-tool’, for instance the above config looks like this:
---
platform: osx
generator: Ninja
build_tool: vscode_cmake
build_type: Debug
The command ./fips gen does the heavy work, it first generates the usual cmake project files, queries information about the project (build targets and header search paths) through the new cmake-server mode, and finally writes the three VSCode config files tasks.json, launch.json and c_cpp_properties.json into the local .vscode directory.
Finally ./fips open starts VSCode (you could just as well run the usual code ., but ./fips open is the same way Visual Studio or Xcode would be launched inside a fips project).
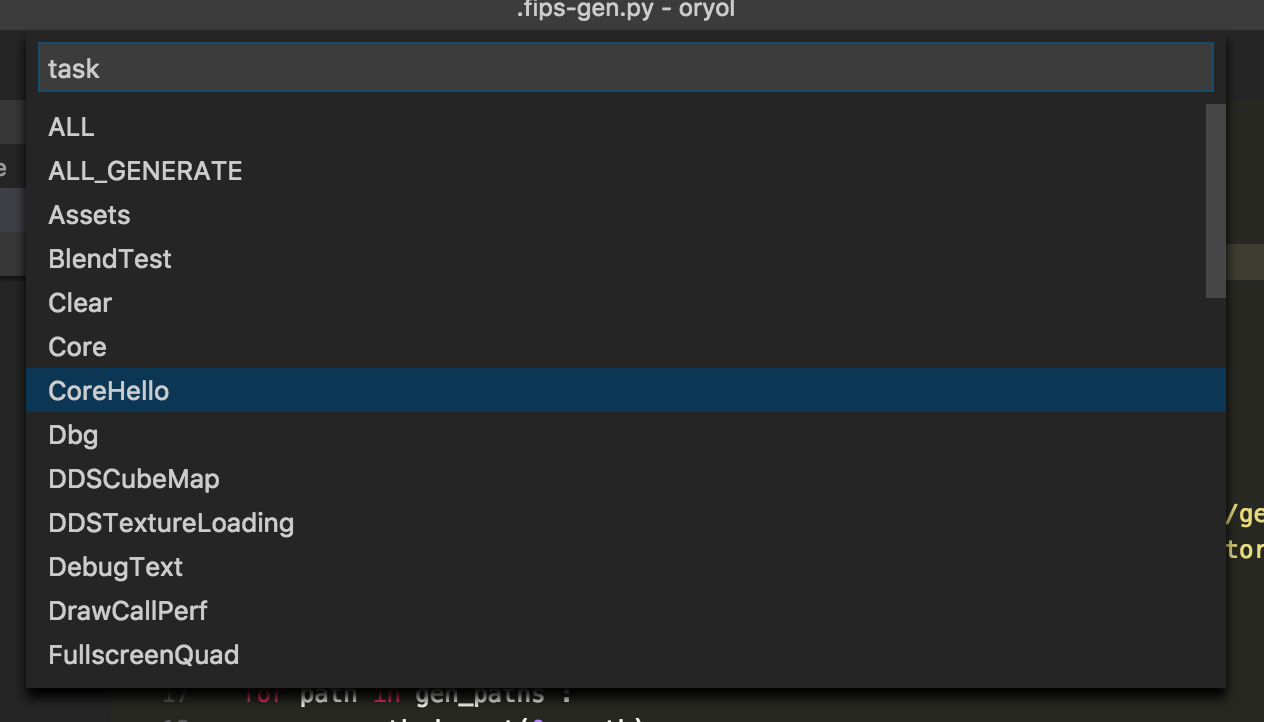
In VSCode, one can immediately hit Ctrl-Shift-B (or rather Cmd-Shift-B on OSX) to build the whole project, or press Cmd-P and start typing ‘task ‘ to see the list of build tasks (./fips gen wrote one build task per cmake build target):
Start typing more and the list of build targets is reduced:
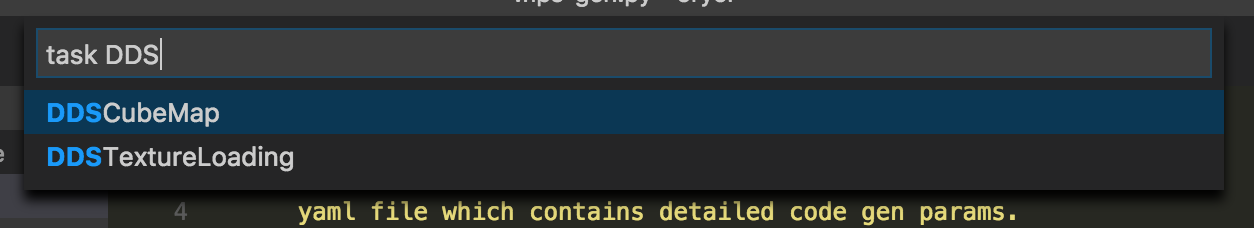
Hit Enter and the build will start, building only that target.
For debugging, fips has created a launch config for each executable target in the cmake project, the list of debug targets is pretty big in the Oryol project since it has all those Oryol code samples:
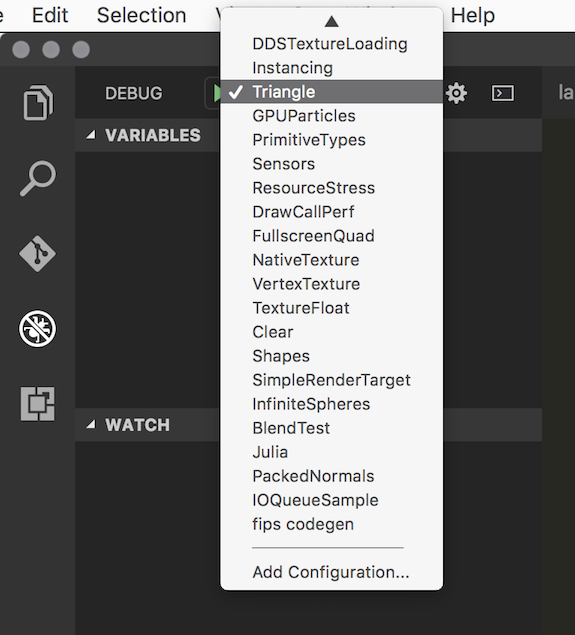
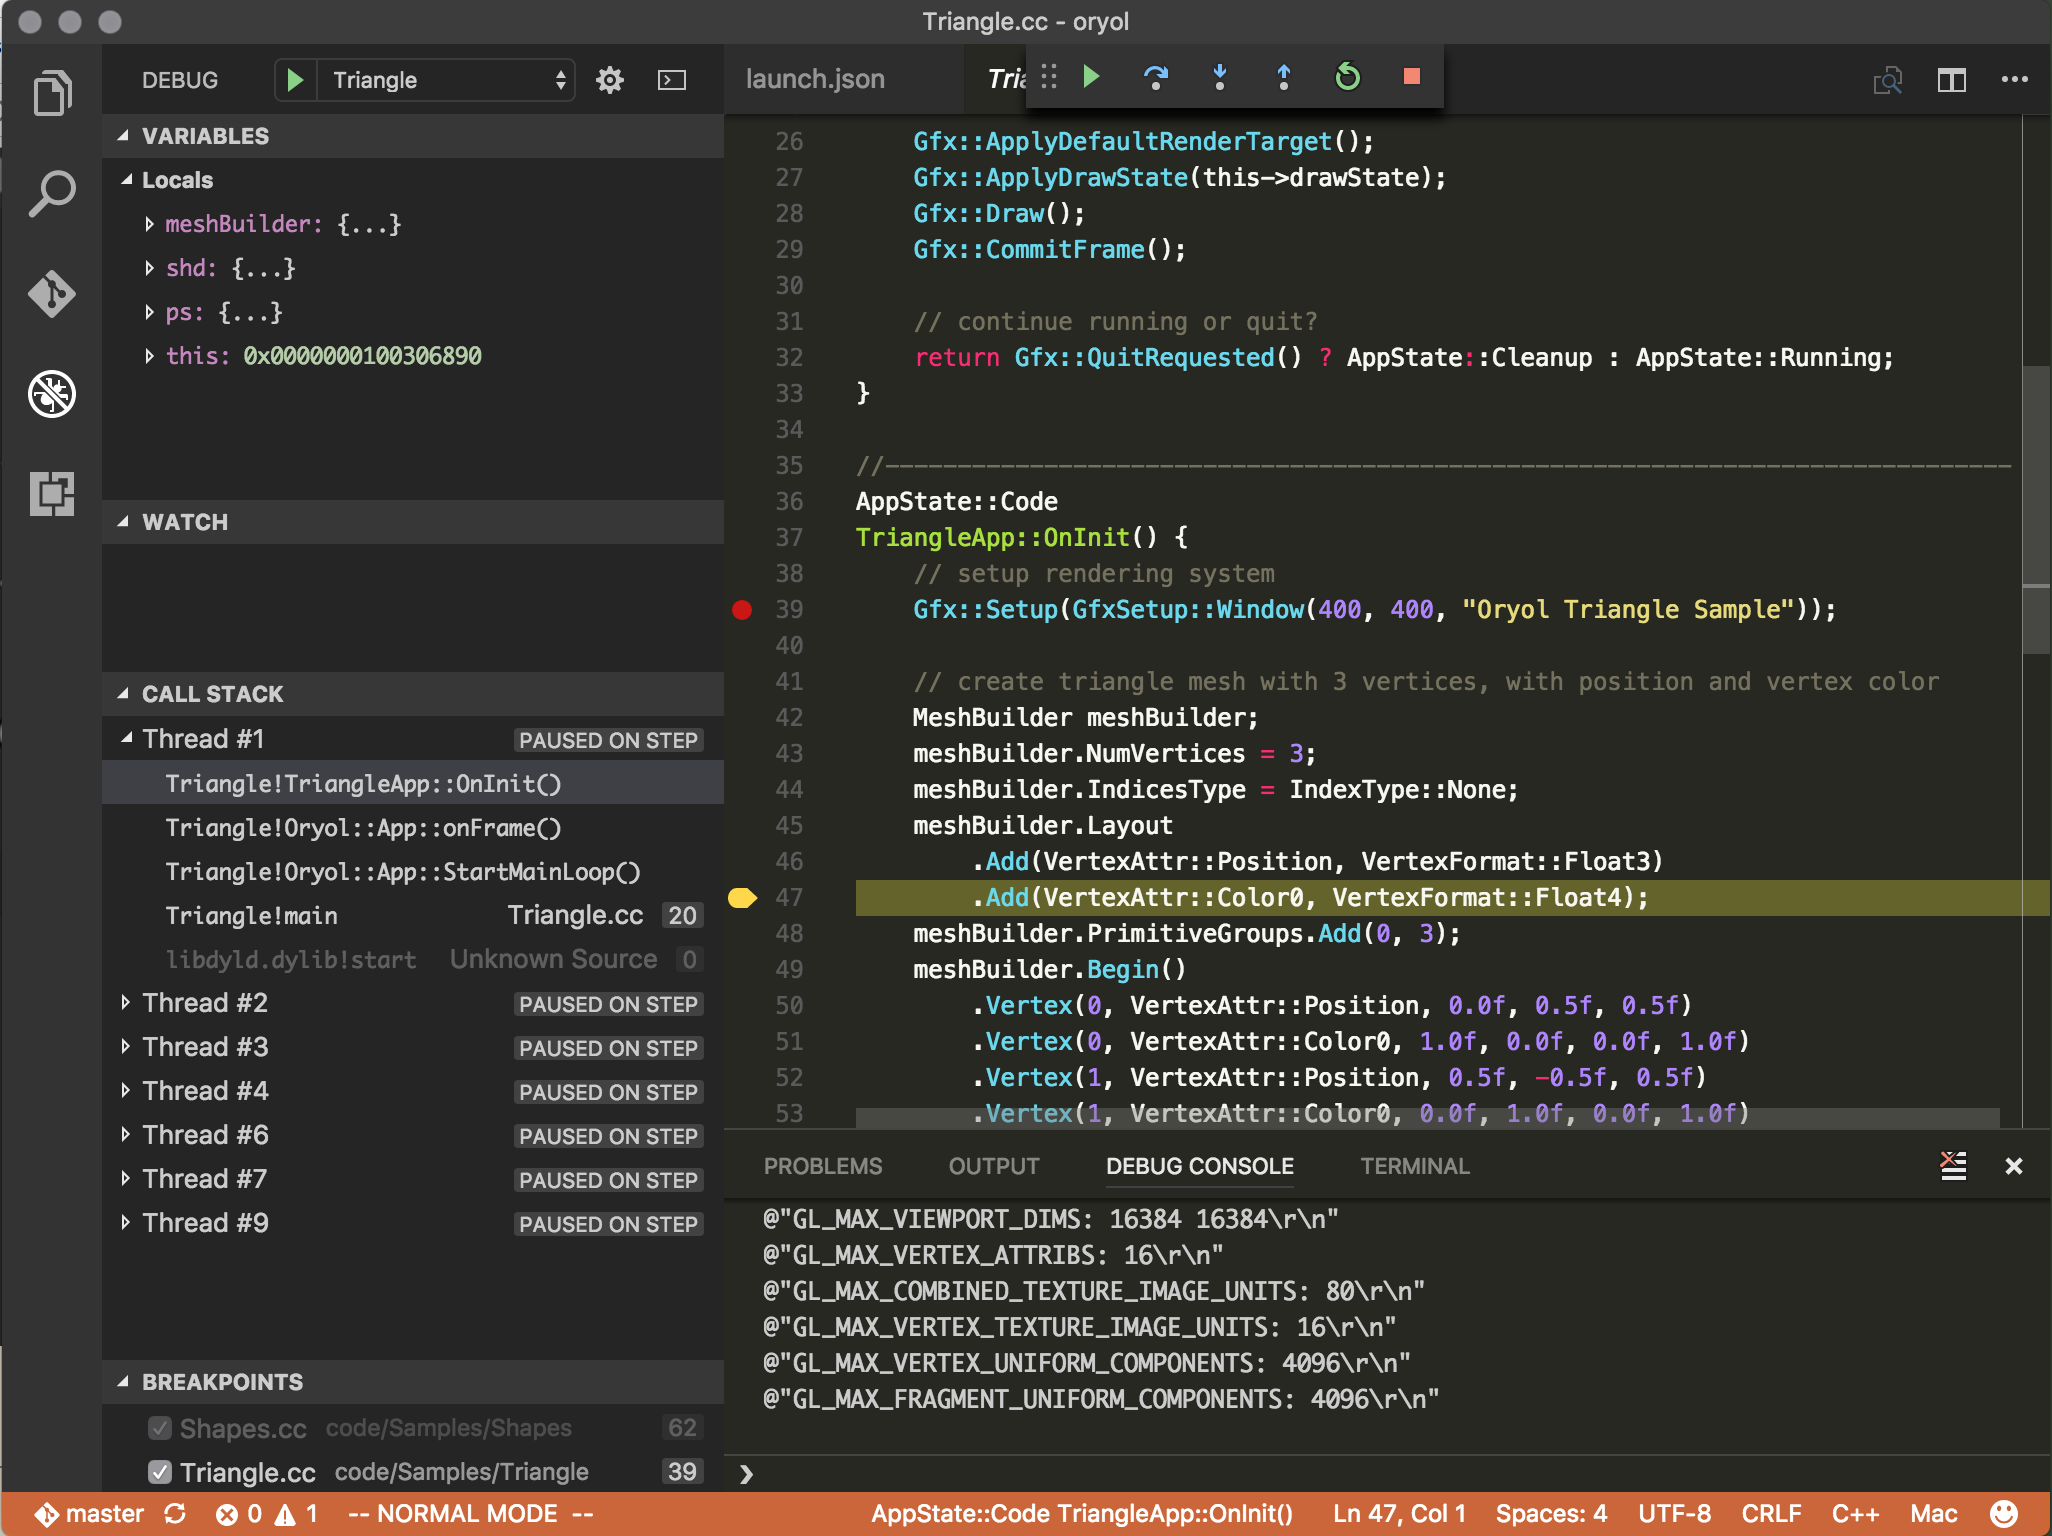
Select the target you want to debug and hit F5, debugging ‘just works’, provided the target has already been built (there’s also a launch option to build the target before debugging but I haven’t tried that out yet). Debugging feels fast, much snappier than in Xcode for instance (even though the debugger engine underneath is the same). Setting breakpoints while the program runs is working, as well as conditional and counter breakpoints, callstacks are there, also for threads, etc…
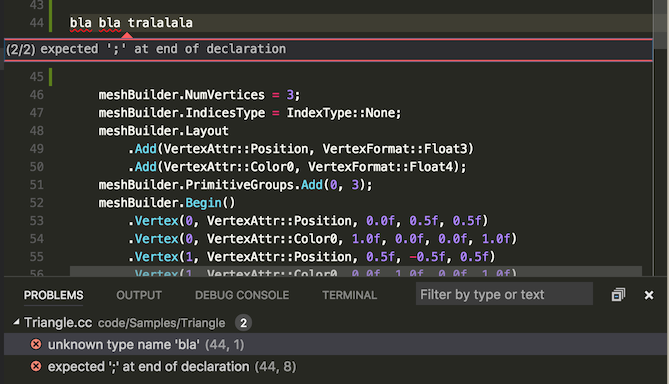
Errors are parsed from the compiler output (more on that later), however this isn’t perfect yet, they show only up after compilation has finished, and stepping through them with F8 doesn’t work right (it only works within the current source file):
One really interesting feature: ./fips gen also writes a debug target for the fips code-generation (which uses python scripts). Selecting the fips-codegen debug target starts the python debugger (this requires the Python VSCode plugin), however there’s also a slight nitpick: this only works if a python file is currently loaded into the editor. Not sure whether this is an intended ‘feature’, an oversight, or an actual bug. But anyway, switching between C++ and Python debugging in the same project is really nice, especially for fips projects that make heavy use of code-generation via python.
For code editing, fips has written the c_cpp_properties.json file with all the header search paths. The VSCode C/C++ plugin uses the paths to resolve type and symbol information for code completion, Cmd-Click on a name to jump to the definition, and so on. Unfortunately proper Intellisense doesn’t work yet though.
And the last nice VSCode featue is the built-in terminal. For fips projects this is interesting because fips is mainly a command line tool to switch between cmake build configs (for cross-compiling), and invoke custom ‘fips verbs’, e.g. for build automation.
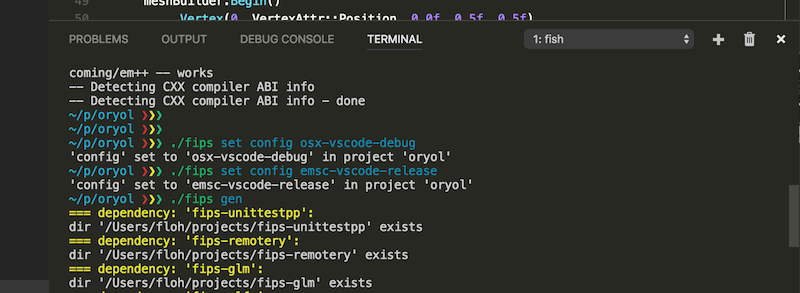
For instance a simple ./fips set config emsc-vscode-release switches the current build config to emscripten, hit Cmd-Shift-B and VSCode will build the emscripten targets instead of native OSX code (debugging emscripten targets doesn’t work though, but who knows, with WebAssembly on the horizon, and VSCode’s flexible debugger extension interface…).
Anyway, here’s the VSCode terminal, I use the Fish shell on OSX, and VSCode picks this up, it feels snappy and I haven’t encountered any problems so far:
How it works under the hood
There are just 2 pieces of python glue code, one to start cmake in server mode and get a JSON file with the complete dump of cmake’s internal data tree (called the ‘codemodel’), and another part which loads this JSON file, finds the relevant pieces of information (targets and header search paths) and writes the VSCode config files.
The whole code is a bit sloppy/hacky at the moment, especially the whole cmake-server part. First, I don’t know why I need to start it with –debug, because otherwise I will simply get an EACCES error (also when starting manually from the command line), second: cmake-server is normally intended to be used as a long-running process which IDEs talk to in order to control cmake and query information from it. I’m not using it this way, instead I’m only starting it up, send the necessary commands to get to the codemodel info, and dump everything that’s coming back from the cmake-server (through stdout) into a file.
Here’s the code for getting the ‘codemodel’ info out of cmake (as of the time this blog post was written):
And here’s the code which extracts the build targets and header search paths from the cmake code model and writes the 3 VSCode config files:
The code isn’t exactly pretty, but whatever ;)
Oh, almost forgot one thing: it took me a bit to figure out how VSCode actually parses compiler warnings and errors so that they can be clicked on. The concept is called ‘problem matcher’, each build task needs its own problem-matcher item, and it’s basically a regular expression to identify compiler error messages and extract the relevant pieces. The VSCode docs conveniently have an example for gcc/clang error messages. Such a problem matcher looks like this:
And that’s it! I think I’ll tinker around a bit with VSCode support in the next few days and also make it work on Linux and Windows.
With the speed how VSCode is currently evolving I can already see it as my main IDE on all platforms in the very near future, the most critical feature (the debugger) is already working quite well (and that means a lot on OSX and Linux!), and VSCode made me even switch away from vim for emscripten development (I still use vim for quickly firing up an editor in a text terminal though, but I really hit a wall with vim plugins for coding and debugging).
Until next time!