WASM Debugging with Emscripten and VSCode
TL;DR: glueing together VSCode, Cmake and the Emscripten SDK to enable an IDE-like workflow (including debugging).
17-Nov-2024: looks like the problem that ‘early breakpoints’ are not caught is fixed, woohoo!
09-Oct-2024: updated for the latest sokol_gfx.h and VSCode extension versions.
This is written from the perspective of a UNIX-like OS (macOS or Linux), but should also work on Windows with some minor tweaks.
Prerequisites
First make sure that the following tools are in the path:
- git
- cmake
- ninja
You’ll also need VSCode and Chrome installed.
On macOS I’d recommend using Homebrew and on Windows Scoop to install those. On Linux of course, your system’s standard package manager.
Emscripten Hello World
Let’s start from scratch. On the command line:
mkdir hello
cd hello
git init
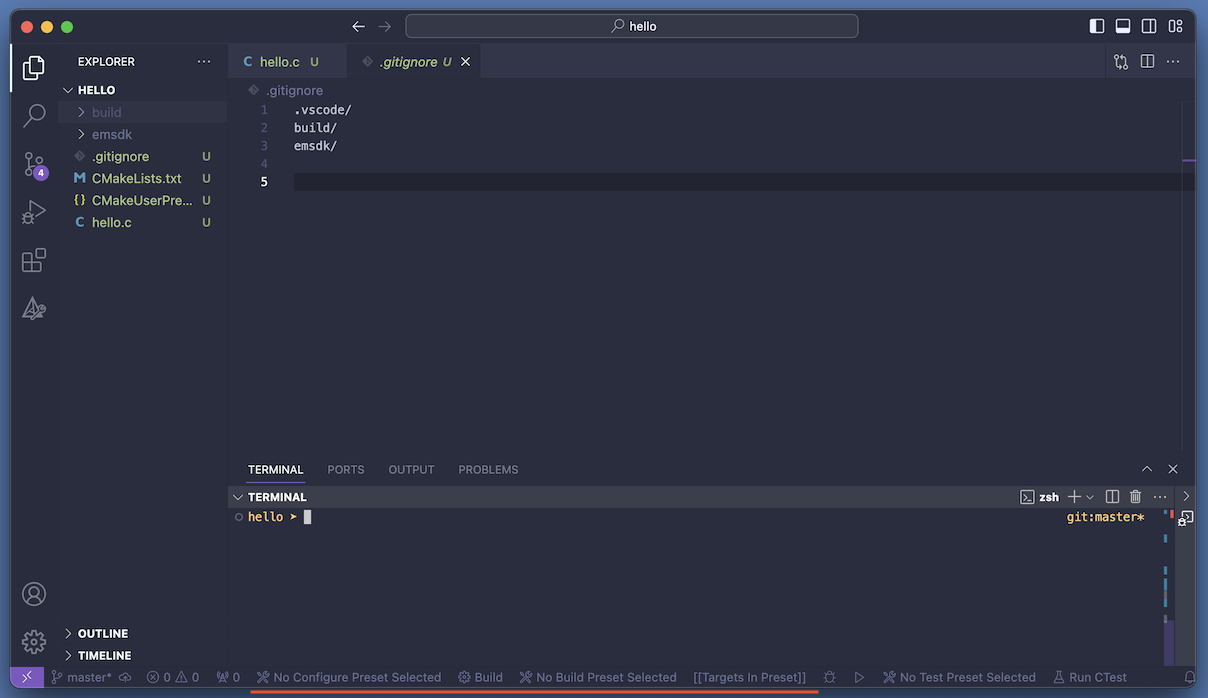
Add a .gitignore file:
.gitignore
build/
emsdk/
Install the Emscripten SDK, we’ll do so in a way that it doesn’t leave a trace on your system when
deleted so don’t worry. Still inside the hello directory:
git clone --depth=1 https://github.com/emscripten-core/emsdk
cd emsdk
./emsdk install latest
./emsdk activate --embedded latest
cd ..
Don’t forget the ./emsdk activate --embedded latest step! (happens to me all the time)
…let’s check if that worked. Create a hello.c source file in the hello project directory:
hello.c
#include <stdio.h>

int main() {
    printf("Hello World!\n");
    return 0;
}
…compile that into a .wasm/.js pair runnable with node.js:
emsdk/upstream/emscripten/emcc hello.c -o hello.js
…there should be a hello.js and hello.wasm file now:
ls
emsdk      hello.c    hello.js   hello.wasm
…run the hello.js file via node.js (depending on the emsdk version the path may differ):
emsdk/node/18.20.3_64bit/bin/node hello.js
…you should see a Hello World! printed to the terminal.
Delete the compiler output, we don’t need that anymore:
rm hello.js hello.wasm
CMake + Emscripten
Let’s bake the build process into a cmake file. Create a CMakeLists.txt
file in the hello project directory:
CMakeLists.txt
cmake_minimum_required(VERSION 3.21)
project(hello)
add_executable(hello hello.c)
if (CMAKE_SYSTEM_NAME STREQUAL Emscripten)
    set(CMAKE_EXECUTABLE_SUFFIX .js)
endif()
…and since this is a cross-compilation scenario, let’s also create a CMakeUserPresets.json file. This simplifies calling cmake with the right arguments for cross-compilation, and will help us later when integrating with VSCode:
CMakeUserPresets.json
{
    "version": 3,
    "cmakeMinimumRequired": {
        "major": 3,
        "minor": 21,
        "patch": 0
    },
    "configurePresets": [
        {
            "name": "default",
            "displayName": "Emscripten",
            "binaryDir": "build",
            "generator": "Ninja Multi-Config",
            "toolchainFile": "emsdk/upstream/emscripten/cmake/Modules/Platform/Emscripten.cmake"
        }
    ],
    "buildPresets": [
        {
            "name": "Debug",
            "configurePreset": "default",
            "configuration": "Debug"
        },
        {
            "name": "Release",
            "configurePreset": "default",
            "configuration": "Release"
        }
    ]
}
…let’s configure and build with cmake:
cmake --preset default -B build
cmake --build build --preset Debug
…and run with node.js:
emsdk/node/18.20.3_64bit/bin/node build/Debug/hello.js
…this should again print Hello World!.
VSCode + CMake + Emscripten
Let’s integrate what we have so far with VSCode!
You’ll need the following VSCode extensions:
…with those installed, start VSCode from within the hello project directory:
code .
You should see something like this, pay attention to the status bar at the bottom (underlined in red), these items are used to control the cmake build config and target:
(NOTE 09-Oct-2024: the underlined items in the bottom bar have moved into the CMake Tools sidepanel in recent versions).
Clicking those allows you to select a Configure- and Build-Preset, and a build target.
Change those that it looks like this:

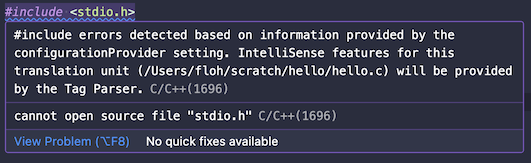
Here we also encounter the first wart, the CMake Tools extension isn’t able to communicate the correct Emscripten sysroot include paths over to the C/C++ extension. You’ll see an error squiggle under the stdio.h include path:
I haven’t found a solution to this problem, it looks like a bug in the CMake Tools extension. Annoying for sure, but not a showstopper, because only Intellisense is affected, building should work fine.
You can test that by pressing F7, or run the palette command CMake: Build. You should
see something like this in the VSCode Output panel:
[main] Building folder: hello
[build] Starting build
[proc] Executing command: /opt/homebrew/bin/cmake --build /Users/floh/scratch/hello/build --config Debug --target hello
[build] [1/2] Building C object CMakeFiles/hello.dir/Debug/hello.c.o
[build] [2/2] Linking C executable Debug/hello.js
[driver] Build completed: 00:00:00.361
[build] Build finished with exit code
Debugging
…next lets make debugging work!
Create a launch.json file in the .vscode subdirectory:
.vscode/launch.json
{
    "version": "0.2.0",
    "configurations": [
        {
            "name": "Launch",
            "type": "node",
            "request": "launch",
            "program": "build/Debug/${command:cmake.launchTargetFilename}",
        }
    ]
}
Pressing F5 should now work. You should see a Hello World! in the VSCode Debug Panel.
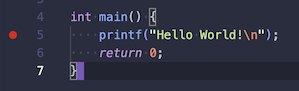
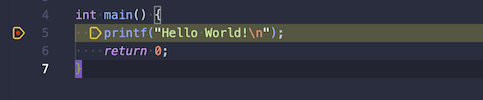
But when trying to debug there’s the next wart. Try to set a breakpoint in the C source code:
Now hit F5. We’d expect that the execution stops at the breakpoint, but that doesn’t happen.
This is a known issue in the DWARF debugging extension. From the documentation:
Breakpoints in WebAssembly code are resolved asynchronously, so breakpoints hit early on in a program’s lifecycle may be missed. There are plans to fix this in the future. If you’re debugging in a browser, you can refresh the page for your breakpoint to be hit. If you’re in Node.js, you can add an artificial delay, or set another breakpoint, after your WebAssembly module is loaded but before your desired breakpoint is hit.
Hopefully this problem will be fixed soon-ish, since it’s currently the most annoying.
One workaround is to first set a breakpoint in the Javascript launch file at a point where the WASM blob has been loaded.
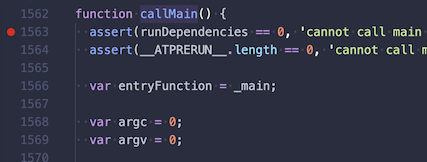
Load the file build/Debug/hello.js into the editor, search the function callMain, and set a breakpoint there:
Press F5 and execution should stop at that breakpoint. Now press F5 again and execution should stop in the C code’s main() function
(assuming that breakpoint is still set):
Yay. This is how debugging works for a Node.js Emscripten application.
Moving into the web browser
Let’s extend our hello.c to render something in WebGL2.
Clone the sokol headers into the hello project directory and copy some headers up into the project:
git clone --depth=1 https://github.com/floooh/sokol
cp sokol/sokol_gfx.h sokol/sokol_app.h sokol/sokol_log.h sokol/sokol_glue.h .
…delete the sokol directory since we don’t need it anymore:
rm -rf sokol
Replace the hello.c file with the following code which just clears the canvas with
a dynamically changing color:
hello.c
#define SOKOL_IMPL
#define SOKOL_GLES3
#include "sokol_gfx.h"
#include "sokol_app.h"
#include "sokol_log.h"
#include "sokol_glue.h"

static sg_pass_action pass_action;

static void init(void) {
    sg_setup(&(sg_desc){
        .environment = sglue_environment(),
        .logger.func = slog_func,
    });
    pass_action = (sg_pass_action) {
        .colors[0] = {
            .load_action = SG_LOADACTION_CLEAR,
            .clear_value = { 1.0f, 0.0f, 0.0f, 1.0f }
        }
    };
}

static void frame(void) {
    float g = pass_action.colors[0].clear_value.g + 0.01f;
    pass_action.colors[0].clear_value.g = (g > 1.0f) ? 0.0f : g;
    sg_begin_pass(&(sg_pass){ .action = pass_action, .swapchain = sglue_swapchain() });
    sg_end_pass();
    sg_commit();
}

static void cleanup(void) {
    sg_shutdown();
}

sapp_desc sokol_main(int argc, char* argv[]) {
    (void)argc; (void)argv;
    return (sapp_desc){
        .init_cb = init,
        .frame_cb = frame,
        .cleanup_cb = cleanup,
        .window_title = "clear",
        .icon.sokol_default = true,
        .logger.func = slog_func,
    };
}
…we’ll also need to make a few changes to our CMakeLists.txt file. Emscripten
needs to know that we want a program that runs in the browser. To do that we’ll
simply change the executable file extension to .html. Next we need to tell
Emscripten to link with WebGL2.
Open the CMakeLists.txt file and change the Emscripten if-block like this:
CMakeLists.txt
if (CMAKE_SYSTEM_NAME STREQUAL Emscripten)
    set(CMAKE_EXECUTABLE_SUFFIX .html)
    target_link_options(hello PUBLIC -sUSE_WEBGL2=1)
endif()
In VSCode press F7 to rebuild the program. This should generate three output files
in the build/Debug directory:
- hello.html
- hello.js
- hello.wasm
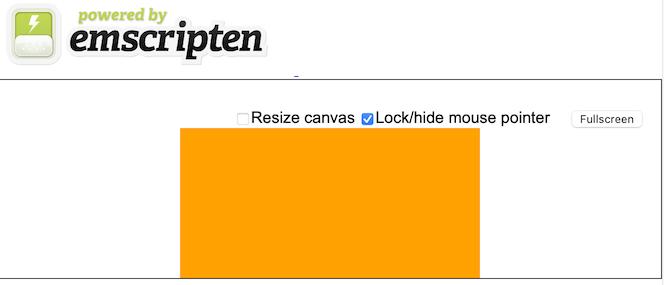
Let’s try to run that in the browser. On the command line in the project directory:
emsdk/upstream/emscripten/emrun build/Debug/hello.html
This should open the system’s default web browser and you should see something like this, with the orange rectangle cycling between yellow and red:
…let’s get rid of the ‘window chrome’ by injecting our own minimal shell.html file.
In the project directory, create a file shell.html looking like this:
shell.html
<!DOCTYPE HTML PUBLIC "-//W3C//DTD HTML 4.01//EN" "http://www.w3.org/TR/html4/strict.dtd">
<html>
<head>
<meta charset="UTF-8"/>
<title>Clear</title>
<style type="text/css">
.game {
    position: absolute;
    top: 0px;
    left: 0px;
    margin: 0px;
    border: 0;
    width: 100%;
    height: 100%;
    overflow: hidden;
    display: block;
    image-rendering: optimizeSpeed;
    image-rendering: -moz-crisp-edges;
    image-rendering: -o-crisp-edges;
    image-rendering: -webkit-optimize-contrast;
    image-rendering: optimize-contrast;
    image-rendering: crisp-edges;
    image-rendering: pixelated;
    -ms-interpolation-mode: nearest-neighbor;
}
</style>
</head>
<body style="background:black">
  <canvas class="game" id="canvas" oncontextmenu="event.preventDefault()"></canvas>
  <script type="text/javascript">
    var Module = {
        preRun: [],
        postRun: [],
        print: (function() {
            return function(text) {
                text = Array.prototype.slice.call(arguments).join(' ');
                console.log(text);
            };
        })(),
        printErr: function(text) {
            text = Array.prototype.slice.call(arguments).join(' ');
            console.error(text);
        },
        canvas: (function() {
            var canvas = document.getElementById('canvas');
            canvas.addEventListener("webglcontextlost", function(e) { alert('FIXME: WebGL context lost, please reload the page'); e.preventDefault(); }, false);
            return canvas;
        })(),
        setStatus: function(text) { },
        monitorRunDependencies: function(left) { },
    };
    window.onerror = function(event) {
        console.log("onerror: " + event.message);
    };
  </script>
  {{{ SCRIPT }}}
</body>
</html>
…and in the CMakeLists.txt file, change the linker options like this:
CMakeLists.txt
target_link_options(hello PUBLIC -sUSE_WEBGL2=1 --shell-file=../shell.html)
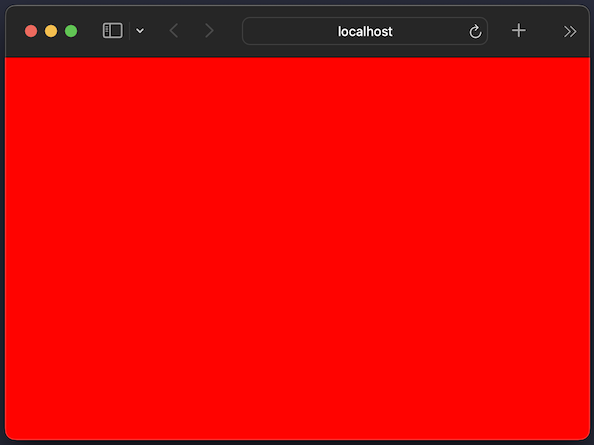
…build the project again by pressing F7 and try opening the result
in the browser:
emsdk/upstream/emscripten/emrun build/Debug/hello.html
…the WebGL canvas should now stretch over the entire window client area:
Browser Remote Debugging
Now on to the last step: making remote debugging work!
First, .vscode/launch.json needs to be changed to start a Chrome remote debug session and a local web server:
.vscode/launch.json
{
    "version": "0.2.0",
    "configurations": [
        {
            "name": "Launch",
            "type": "chrome",
            "request": "launch",
            "url": "http://localhost:3000/build/Debug/${command:cmake.launchTargetFilename}",
            "preLaunchTask": "StartServer",
        }
    ]
}
…note the preLaunchTask, this will start a web server using the Live Preview VSCode extension.
To define the StartServer task, create a file .vscode/tasks.json and populate it like this:
.vscode/tasks.json
{
    "version": "2.0.0",
    "tasks": [
        {
            "label": "StartServer",
            "type": "process",
            "command": "${input:startServer}"
        }
    ],
    "inputs": [
        {
            "id": "startServer",
            "type": "command",
            "command": "livePreview.runServerLoggingTask"
        }
    ]
}
…and that’s it!
When pressing F5, Chrome should now open and load our program:
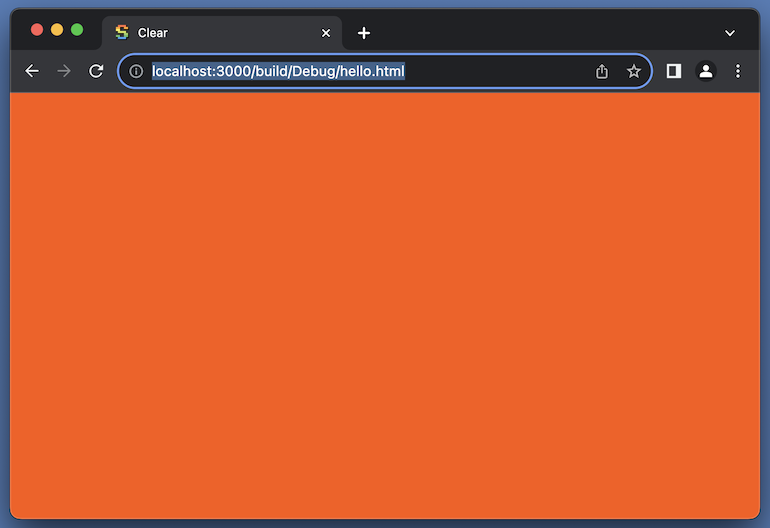
…while the program is running in the browser, set a breakpoint in hello.c
at the start of function void frame(void). The debugger should now stop
at the function and you can step through the code:
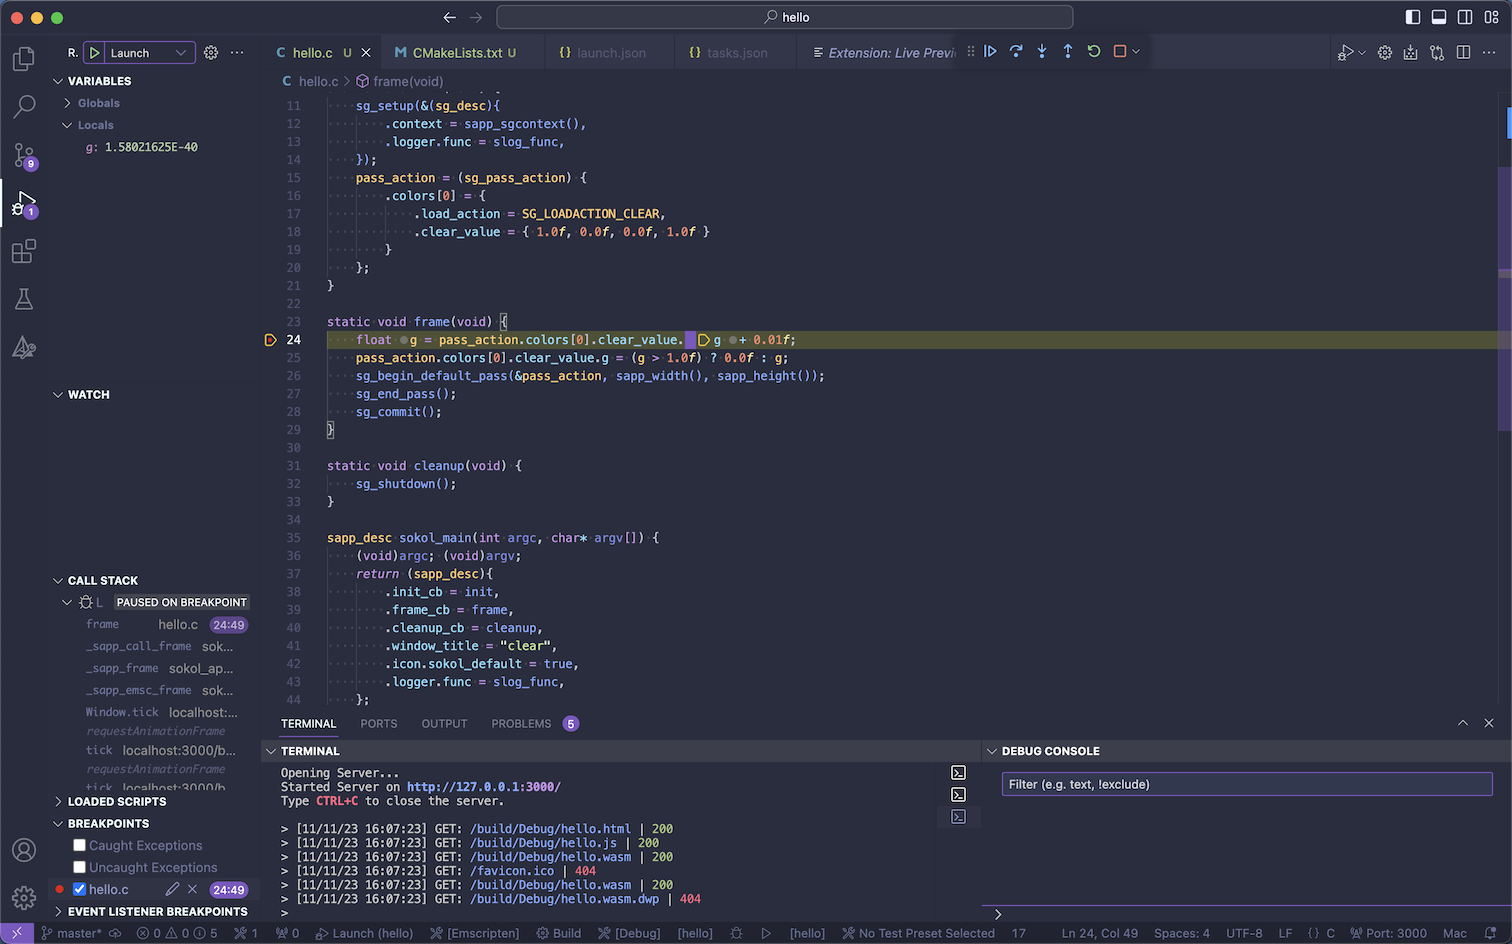
And that’s it! You can now make changes to your code and then compile and
run/debug with F5. The only downside is the known issue that early breakpoints
are not caught. There are two workarounds, first the one already mentioned to set
a breakpoint on the JS side in build/Debug/hello.js in the callMain function
and stop on that first. This seems to catch any early breakpoints on the C side too.
The second option for programs with a render loop is to simply restart the debug session by pressing the ‘Refresh’ button in the VSCode debugger controls:
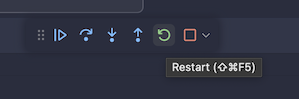
This will also catch early breakpoints on the C side, but will popup a warning that the ‘Live Preview…` task is already running. This can simply be ignored.
You can also find the project described in this blog post on Github:
https://github.com/floooh/vscode-emscripten-debugging
Known Issues
The list of issues I stumbled over, hopefully those will be fixed in the future:
- The CMake Tools extension doesn’t properly communicate the Emscripten system include path to the C/C++ extension so that Intellisense doesn’t work for system headers.
- The WASM DWARF debugging extension doesn’t catch early breakpoints on the C side (known issue).
- The Live Preview extension pops up a warning when refreshing a debug session.