VSCode, WASM, WASI
I did a neat little thing during my year-end vacation: A VSCode extension for retro-assembly coding with the assembler and home computer emulator integrated right into VSCode via WASM and WASI.
The extension is here (careful: it must be installed as pre-release, otherwise installing a dependency extension won’t work, more on that later):
https://marketplace.visualstudio.com/items?itemName=floooh.vscode-kcide
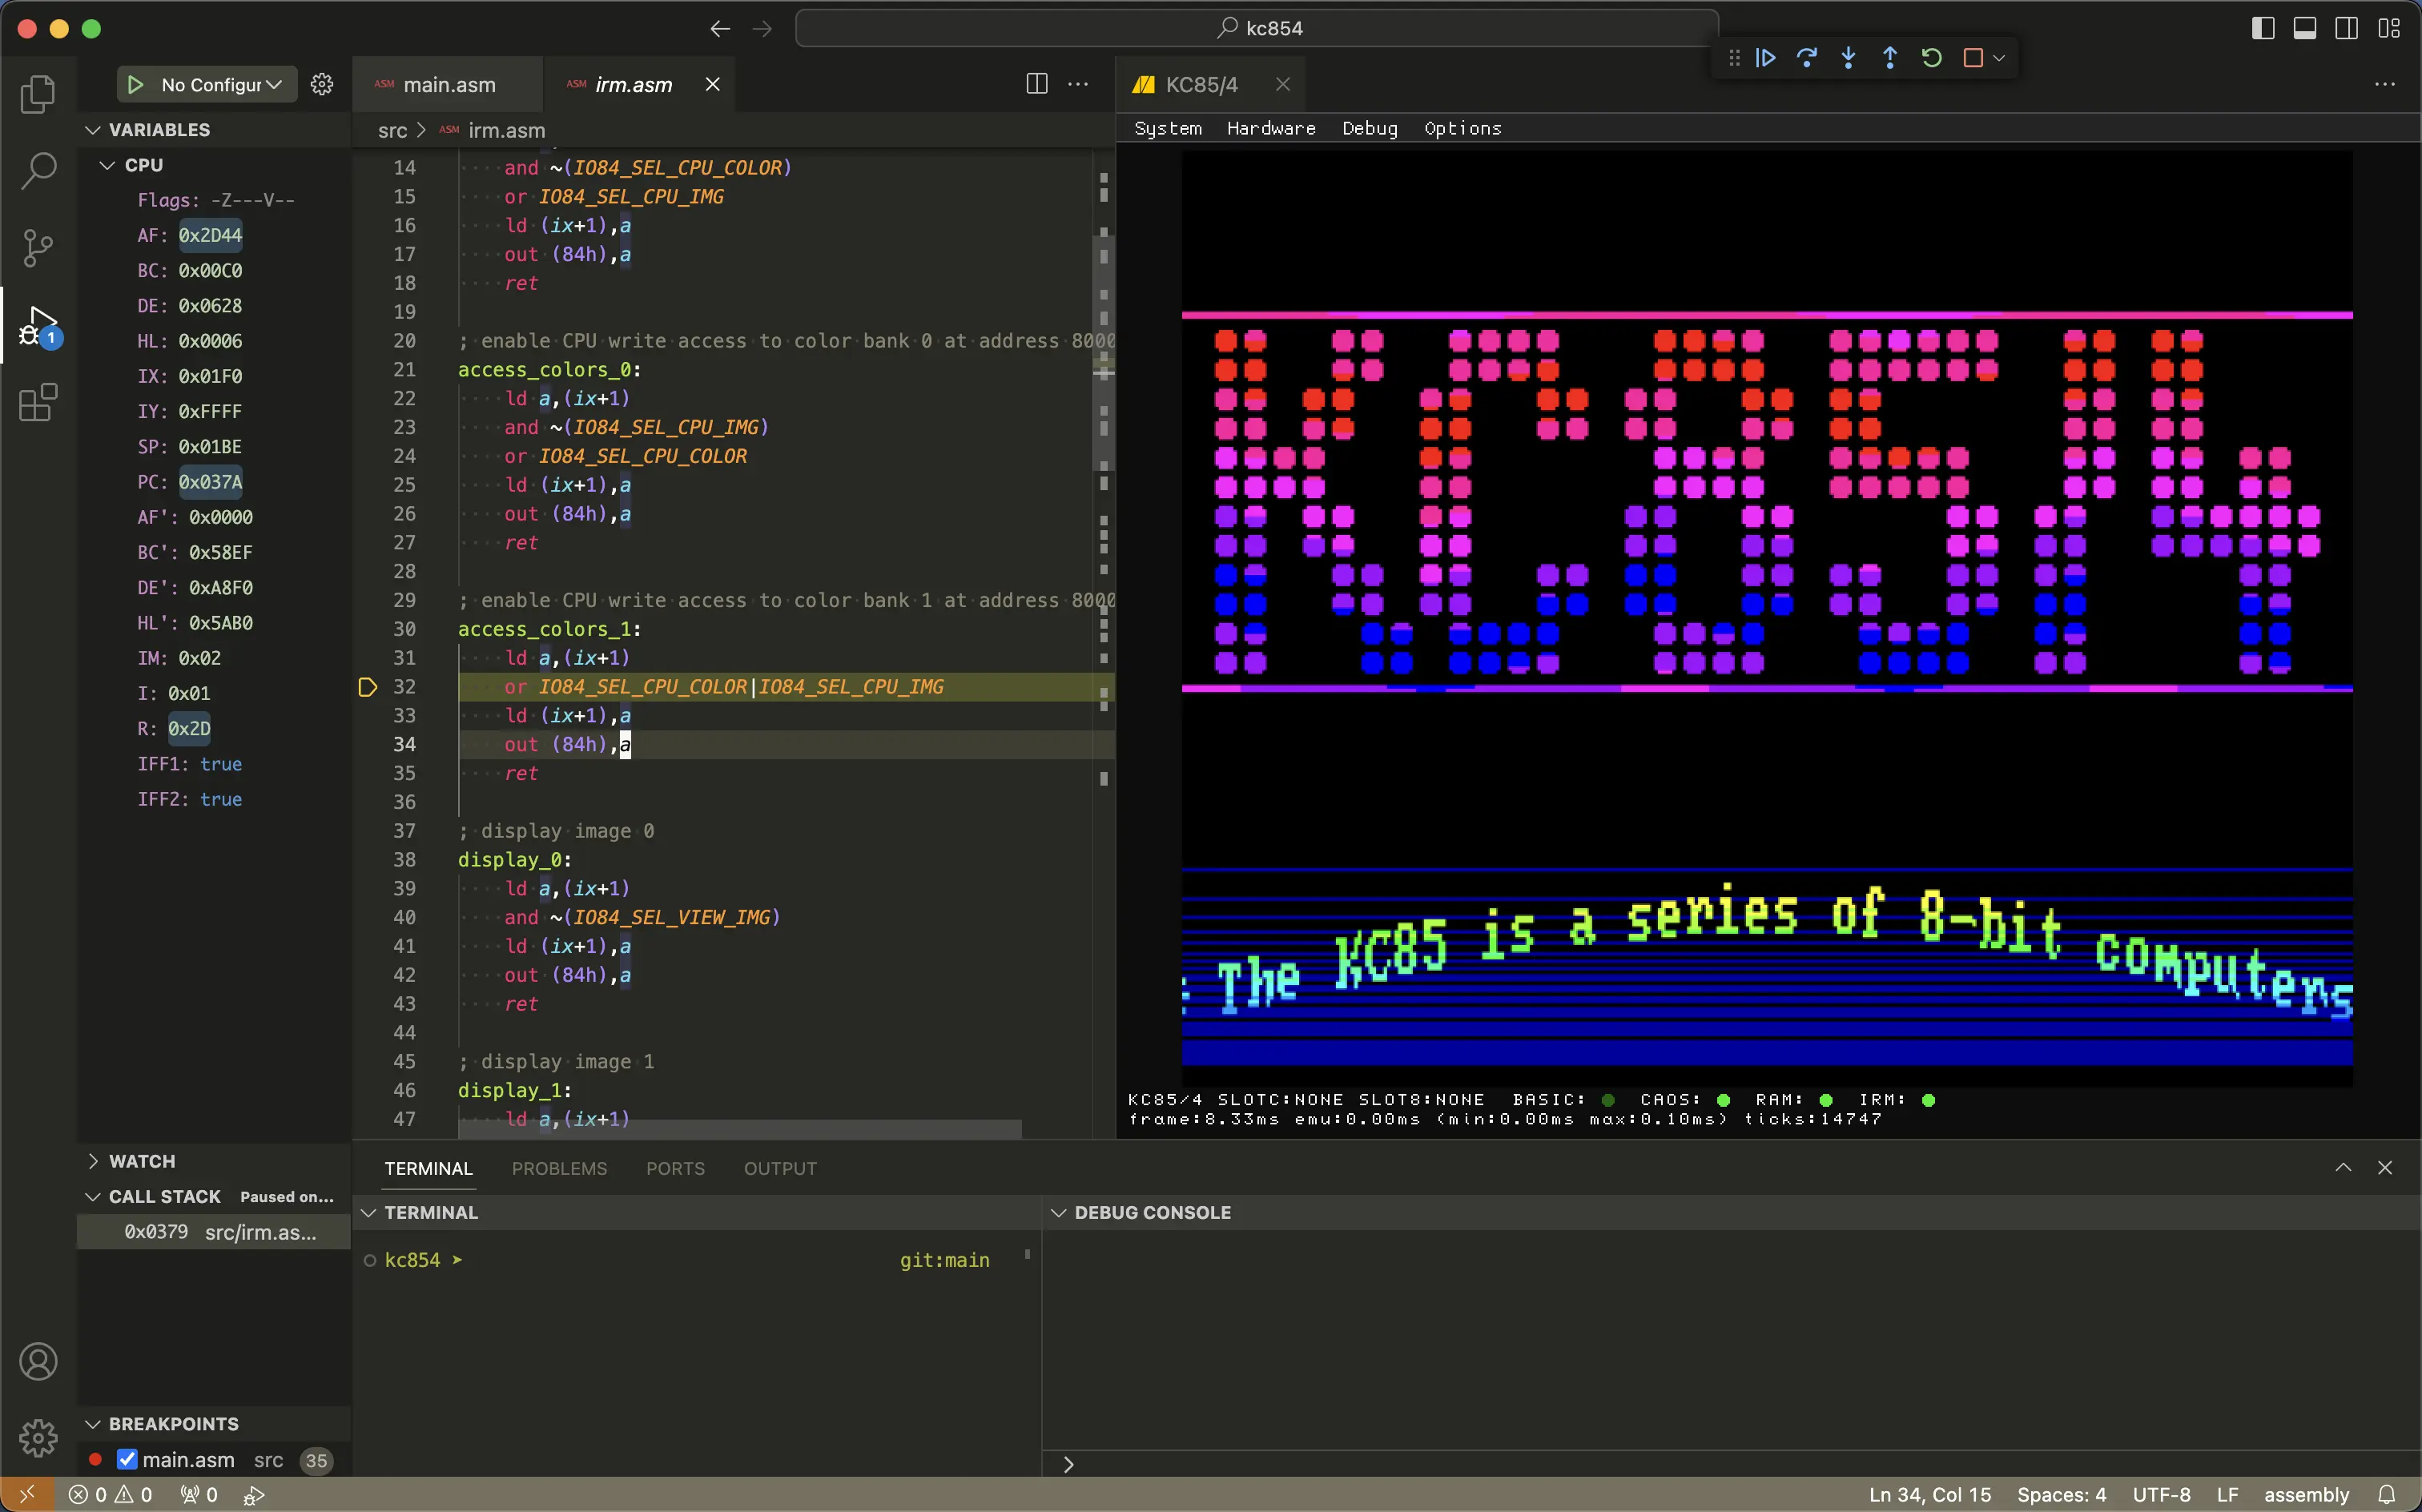
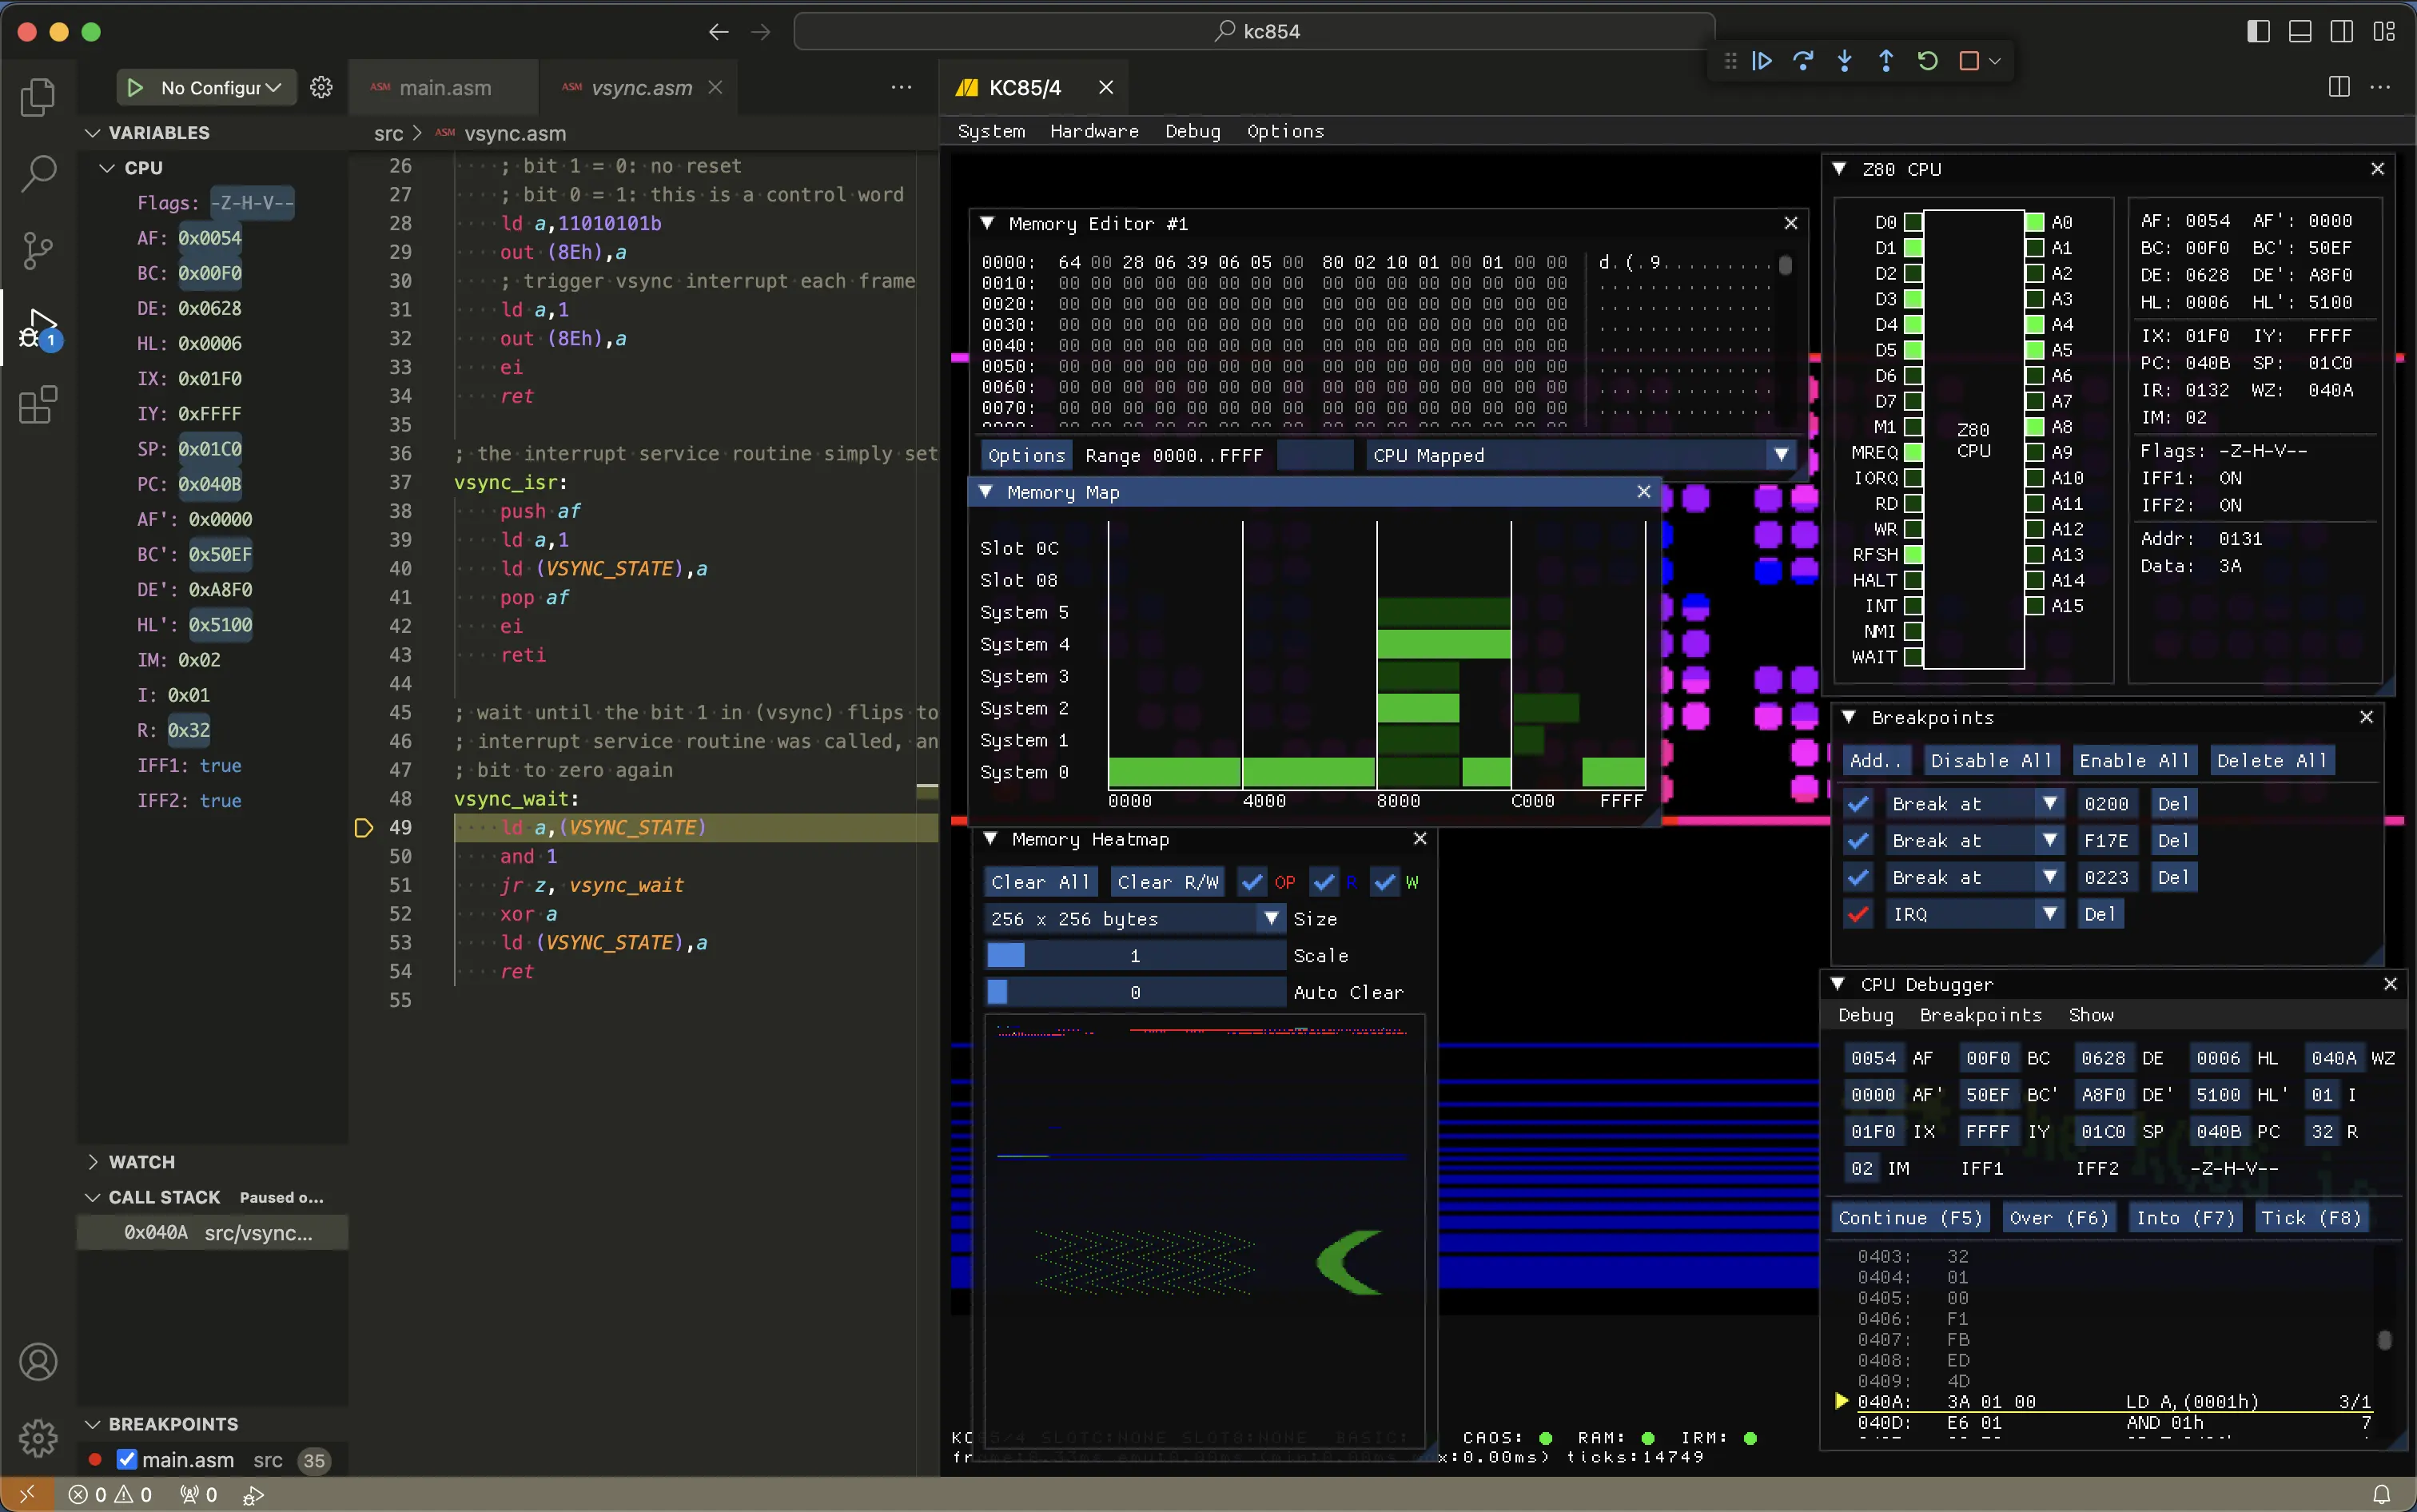
This is what it looks like in action when debugging a KC85/4 demo I wrote for dog-fooding the extension:
The VSCode extension project is here:
https://github.com/floooh/vscode-kcide
…and the samples for KC85/4, C64 and Amstrad CPC are here:
https://github.com/floooh/kcide-sample
The extension also integrates the following projects:
- a fork of the ASMX multi-cpu assembler
- the KC85/4, C64 and CPC emulators from my chips project
Creating a simple VSCode extension is fairly straightforward (see: Your First Extension), so I won’t go into too many details there. What’s interesting is the use of WASM and WASI to integrate projects written in other languages than JS/TS into a VSCode extension.
This allows to bundle the assembler (written in C89) and the emulator (C99 and C++11) directly with the extension as WASM blobs. Similar extensions without WASM components would either need to port the assembler and emulator to JS/TS, ask the user to install and run native tools (most other retro-dev extensions seem to use that approach), or automatically download and install separate platform-specific native tools (the approach used by the Microsoft C/C++ extension), which is asking for a lot of trust from the extension user.
WASM fixes all those issues:
- it’s completely hassle-free for the user because the WASM blobs can be bundled with the extension and everything works out of the box
- it’s less hassle for the extension developer, because a single WASM blob automatically works on all platforms supported by VSCode (including the VSCode web version)
- …and unlike native binaries, WASM and WASI don’t add any more security concerns over regular VSCode extensions written in TS/JS
Also, how cool is it that I can take an assembler written in C89 in the 90’s and safely run that without code changes in the VSCode web version?
(I did actually consider writing my own assembler in Typescript a long time ago just for the purpose of running it in VSCode but quickly abandondend that idea, here are the ruins of that folly: https://github.com/floooh/hcasm)
Paths not taken
I considered various approaches:
- a native IDE via Qt similar to Goran Devic’s Z80 Explorer
- integrate the IDE features right into the emulator via Dear ImGui (the emulators already have an extensive Dear ImGui debugging UI)
- create a VSCode extension which calls into an assembler and emulator written in Typescript
- create a VSCode extension which calls into native assembler and emulator binaries
- create a VSCode extension which uses WASM for the assembler and emulator
The final decision to use VSCode with WASM comes down to a couple of central problems:
- dealing with native tools in a cross-platform scenario is a massive PITA these days:
- running the same binary across different Linux distros is still pretty much an unsolved problem
- on Windows and macOS you’ll get all sorts of scare popups when trying to run an executable downloaded from the internet
- porting a code base to TS/JS just so that it can be hooked up into a VSCode extension is almost always a massive waste of time
In the end it was a decision between (2: extend the existing Dear ImGui emulator UI with IDE features), and (4: figure out how to integrate the assembler and emulator as WASM blobs into a VSCode extension).
While I enjoy writing Dear ImGui UIs immensely, a robust text editing experience which can rival a dedicated text editor like VSCode would be a massive project on its own.
…which leaves (4) as the one option which enables the most robust result for the least amount of work (important, since this is a ‘vacation side project’ which shouldn’t increase my spare time software maintenance burden even more).
All in all the extension was finished in about 3 weeks of focused work (spread over 6 real-world weeks, with 2 weeks spent dog-fooding on a little KC85/4 assembly demo).
Of the 3 weeks working on the VSCode extension, about 2 weeks were spent on the Debug Adapter alone (a lot more effort than I initially expected).
The boring parts
I’ll run very quickly over the parts of the extension that are not all that interesting (since all of that is just reading the VSCode extension documentation about what features can be provided by extensions and how to implement them).
The KC IDE extension implements:
- a handful of Commands which can be invoked via the
Ctrl-Pcommand palette:KCIDE: Build: assembles the source code into a binary file compatible with the current emulatorKCIDE: Debug: builds the source and starts a debugging sessionKCIDE: Open Emulator: (re-)opens the emulator tabKCIDE: Reboot Emulator: cold-boots the emulator and stops active debug sessionKCIDE: Reset Emulator: resets the emulator and stops active debug session (on some home computers, a reset preserves the memory content)
- two Key Bindings:
F5to start a debug session andF7to build the project source code into a binary file - a JSON Schema for a
kcide.project.jsonfile which defines the target computer system, assembly dialect, file paths and output binary file format loadable by the emulator - a Language Grammar for regex-based syntax highlighting (Z80 and 6502 assembly statements, plus ASMX-specific keywords)
- a Debug Adapter to connect the VSCode debugging UI with the (already existing) debugger that’s integrated into the emulator
Some notable VSCode extension features which are not implemented:
- No Language Server (to provide error squiggles and code completion while typing), the LSP protocol is a bit of overkill for low level languages like assembly, while it would have been a ‘nice to have’ feature, it wasn’t doable in the available time, and features similar to a full LSP can most likely also be implemented without a full LSP implementation (VSCode has a couple of other language features like semantic highlighting, snippets or programmatic language features). In the end I simply ran out of time, maybe in the next round of updates…
- No Task Providers (e.g. proper integration with
tasks.jsonandlaunch.json). This also seemed like overkill. Just adding two key bindings while the extension is active (F5for debugging andF7for building) achieves the same thing with less hassle for the user.
Finally, a VSCode extension may run in 3 environments, which has some subtle consequences for what APIs can be used in the extension code:
- desktop: the extension only works in ‘desktop VSCode’ and can use the full set of node.js APIs
- web: the extension works in ‘VSCode for the web’, which means only the VSCode extension API and browser APIs can be called
- universal: the extension can run both in desktop and web VSCode
The KC IDE is a universal extension, but still has some issues when running in the web version of VSCode (which comes down to a mix of VSCode issues and some file-IO related issues I will most likely need to fix on my side).
Integrating the assembler via WASI
This turned out a lot easier than expected, because the VSCode WASI extension does all the hard work.
What this extension basically does is to allow any POSIX commandline tool to run inside VSCode without requiring changes to the source (most notably, no changes are required for blocking file IO code via fopen/fread/fwrite/fclose).
The only thing I had to fix in the ASMX assembler was a separately provided root path for the assembler’s
include statement (which is supposed to work with relative paths). WASI currently doesn’t have the concept
of a ‘current working directory’, so all filesystem paths must be resolved to absolute paths within the
WASI container’s virtual filesystem (a WASI environment doesn’t use direct filesystem paths of the host system,
but instead defines its own virtual filesystem with mount points mapped to host system directories).
The basic procedure to get the assembler working inside VSCode is:
- compile the assembler to a WASI blob using the WASI SDK Clang toolchain, this happens manually outside the extension project, the resulting .wasm blob is then simply committed into the extension’s git repo and bundled with the published extension. The size of the WASM blob is about 200 KBytes.
-
in the VSCode extension code: initialize the WASI runtime, setup a virtual filesystem, and load and compile the assembler WASM blob, this happens only once during the extension’s life cycle:
export async function requireWasiEnv(ext: ExtensionContext): Promise<WasiEnv> { if (wasiEnv === null) { const wasm = await Wasm.load(); const fs = await wasm.createRootFileSystem([ { kind: 'workspaceFolder' } ]); const bits = await workspace.fs.readFile(Uri.joinPath(ext.extensionUri, 'media/asmx.wasm')); const asmx = await WebAssembly.compile(bits); wasiEnv = { wasm, fs, asmx }; } return wasiEnv; } -
run the assembler WASM blob, capture stdout and stderr and check the exit code, this is quite similar to how a native tool would be launched:
export async function runAsmx(ext: ExtensionContext, args: string[]): Promise<RunAsmxResult> { const wasiEnv = await requireWasiEnv(ext); const process = await wasiEnv.wasm.createProcess('asmx', wasiEnv.asmx, { rootFileSystem: wasiEnv.fs, stdio: { out: { kind: 'pipeOut' }, err: { kind: 'pipeOut' }, }, args, }); const decoder = new TextDecoder('utf-8'); let stderr = ''; let stdout = ''; process.stderr!.onData((data) => { stderr += decoder.decode(data); }); process.stdout!.onData((data) => { stdout += decoder.decode(data); }); const exitCode = await process.run(); return { exitCode, stdout, stderr }; } - the KC IDE extension will then parse the assembler error messages in stderr and convert the error messages into VSCode Diagnostic objects,
which then show up in the
Problemspanel and as error squiggles in the text editor - the actual assembler output files are written directly into the host filesystem via the virtual filesystem mapping that was provided when initializing the WASI runtime
Integrating the emulator
The embedded home computer emulators are taken from the chips project, those are implemented in C/C++, use the sokol headers for abstracting platform details and run both as natively compiled executables and in the browser via WASM and WebGL, compiled with the Emscripten SDK.
One emulator WASM blob is about 700..800 KBytes (most of that is the Dear ImGui debugging UI which costs about 450 Kbytes).
Currently the KC IDE extension contains 4 emulators (KC85/3, KC85/4, C64 and CPC) which adds up to about 3 MBytes (if there will be drastically more supported systems in the future I’ll need to come up with a solution to reduce the size of the embedded emulators, either downloading them on demand, merge them into a single ‘multi-system-emulator’ binary, or maybe moving the UI into a shared WASM module that’s loaded like a DLL).
The emulator is running inside a VSCode webview panel. For the
most part this is quite straightforward for an Emscripten WebGL application by taking an index.html like this (note the placeholders {{{shell}}} and {{{emu}}}, those must be replaced with runtime-generated URLs), and setup
a webview panel object like this.
There’s a couple of interesting details in that code:
The webview panel cannot simply load resources from anywhere in the host file system, instead a localResourceRoot must be provided
in the window.createWebviewPanel() call which points to the extension subdirectory media/ (e.g. anything that’s loaded in the
webview panel needs to be located in that media/ subdirectory):
    const rootUri = Uri.joinPath(getExtensionUri(), 'media');
    const panel = window.createWebviewPanel(
      // ...
      {
        localResourceRoots: [ rootUri ],
      }
    );
…next, all URLs referenced in the webview panel’s HTML content must be generated via the webview panel API, I’m doing that by loading a HTML template file and then replace the placeholders inside {{{...}}} with generated URLs (and while
at it, I also select the correct emulator to load):
    let emuFilename;
    switch (project.emulator.system) {
        case System.KC853:      emuFilename = 'kc853-ui.js'; break;
        case System.C64:        emuFilename = 'c64-ui.js'; break;
        case System.CPC6128:    emuFilename = 'cpc-ui.js'; break;
        default:                emuFilename = 'kc854-ui.js'; break;
    }
    const emuUri = panel.webview.asWebviewUri(Uri.joinPath(rootUri, emuFilename));
    const shellUri = panel.webview.asWebviewUri(Uri.joinPath(rootUri, 'shell.js'));
    const templ = await readTextFile(Uri.joinPath(rootUri, 'shell.html'));
    const html = templ.replace('{{{emu}}}', emuUri.toString()).replace('{{{shell}}}', shellUri.toString());
    panel.webview.html = html;
Communication between VSCode and the WebView panel content works via bi-directional message passing, this means the VSCode extension needs to register a listener function which dispatches received messages to their handler functions:
    panel.webview.onDidReceiveMessage((msg) => {
        if (msg.command === 'emu_cpustate') {
            cpuStateResolved(msg.state as CPUState);
        } else if (msg.command === 'emu_disassembly') {
            disassemblyResolved(msg.result as DisasmLine[]);
        } else if (msg.command === 'emu_memory') {
            readMemoryResolved(msg.result as ReadMemoryResult);
        } else if (msg.command === 'emu_ready') {
            if (state) {
                state.ready = msg.isReady;
            }
        } else {
            KCIDEDebugSession.onEmulatorMessage(msg);
        }
    });
…sending a message into the opposite direction (from the debug session to the webview panel) simply looks like this:
await state.panel.webview.postMessage({ cmd: 'boot' });
…the message structure is entirely custom (and I’m just noticing that I’m using command in one direction,
but cmd in the other direction… but anyway…).
There is one missing step in the communication between VSCode debug session on one side, and the emulator on the other. There’s a Javascript shim running in the context of the webpage which translates between the JSON-like message objects which are sent and received by the VSCode debug session, and a lower level WASM function call interface implemented by the emulator.
When a message is received from the VSCode debug session in the emulator’s HTML page, it’s dispatched to a Javascript function via
an event listener added to the window object (note that this code is plain Javascript, not Typescript):
    window.addEventListener('message', ev => {
        const msg = ev.data;
        switch (msg.cmd) {
            case 'boot': kcide_boot(); break;
            case 'reset': kcide_reset(); break;
            case 'ready': kcide_ready(); break;
            case 'load': kcide_load(msg.data); break;
            // ...
            case 'disassemble': kcide_dbgDisassemble(msg.addr, msg.offsetLines, msg.numLines); break;
            case 'readMemory': kcide_dbgReadMemory(msg.addr, msg.numBytes); break;
            default: console.log(`unknown cmd called: ${msg.cmd}`); break;
        }
    });
Such a handler function looks like this:
function kcide_boot() {
    Module._webapi_boot();
}
This is an ‘Emscripten-ism’. The easiest way to export a C function from WASM to Javascript is via the
EMSCRIPTEN_KEEPALIVE attribute in the C source, like this:
EMSCRIPTEN_KEEPALIVE void webapi_boot(void) {
    if (state.inited && state.funcs.boot) {
        state.funcs.boot();
    }
}
When Emscripten builds the project, it keeps track of all EMSCRIPTEN_KEEPALIVE C functions and makes them
available as Javascript functions on a global Module object created by the Emscripten entry stub. Calling
such an EMSCRIPTEN_KEEPALIVE C function from the Javascript side then looks like this:
Module._webapi_boot();
…and that’s essentially how the communication between VSCode and the WASM emulator works. For instance, when the VSCode palette command
KCIDE: Reboot Emulator is executed, eventually the C function webapi_boot() in the WASM emulator will be
called, which reboots the emulator.
Currently the emulators implement the following ‘web API’ functions callable from Javascript:
void webapi_dbg_connect(void);          // a VSCode debug session has started
void webapi_dbg_disconnect(void);       // a VSCode debug session has ended
void* webapi_alloc(int size);           // helper function to allocate on the WASM heap from Javascript
void webapi_free(void*);                // helper function to free memory allocated via webapi_alloc()
void webapi_boot(void);                 // reboot the emulator (e.g. switch off and on)
void webapi_reset(void);                // reset the emulator (e.g. press the reset button)
bool webapi_ready(void);                // returns true when the emulator is ready to start a debug session after rebooting
bool webapi_load(void* ptr, int size);  // load binary data into the emulator
void webapi_dbg_add_breakpoint(uint16_t addr);    // add a debug breakpoint at a 16-bit address
void webapi_dbg_remove_breakpoint(uint16_t addr); // delete a debug breakpoint at a 16-bit address
void webapi_dbg_break(void);            // break into the debugger
void webapi_dbg_continue(void);         // continue execution when stopped in debugger
void webapi_dbg_step_next(void);        // execute a 'step over' in the debugger
void webapi_dbg_step_into(void);        // execute a 'step into' in the debugger
uint16_t* webapi_dbg_cpu_state(void);   // request a raw 'CPU state' dump (current register values)
webapi_dasm_line_t* webapi_dbg_request_disassembly(/*...*/); // request a disassembly dump over a range of addresses
uint8_t* webapi_dbg_read_memory(uint16_t addr, int num_bytes); // request a memory dump over a range of addresses
In the opposite direction (from the emulator to the VSCode debug session), the emulator calls into the following C callback functions, which in turn call into Javascript to create a JSON-like message object to send back into the VSCode debug session:
void webapi_event_stopped(int stop_reason, uint16_t addr);    // debugger has stopped at addr for a specific reason
void webapi_event_continued(void);                            // the debugger has continued execution
void webapi_event_reboot(void);                               // the emulator has been rebooted
void void webapi_event_reset(void);                           // the emulator has been reset
…in a nutshell, this is the minimal ‘virtual machine’ interface required to implement a somewhat feature-complete VSCode Debug Adapter.
One downside of the Debug Adapter Protocol is that it is clearly designed towards high level languages, and the protocol feature set has little overlap with debugging features that are desired in an emulator virtual machine.
But thankfully, the Debug Adapter Protocol is also flexible enough that it can work side by side with the much more powerful debugger that’s already integrated in the chips-emulators via Dear ImGui:
…for instance, the embedded Dear ImGui debugger allows to step the emulator forward in single clock cycles, while the VSCode debugger only steps at instruction or source line granularity.
Known Issues and future updates
There’s a couple of issues which are currently worked around or don’t work at all, and which I want to fix in future updates (most of those are only an issue in the VSCode web version, so not exactly show stoppers):
-
Hopefully the VSCode WASI extension will go out of pre-release-only mode rather sooner than later, at that point I can also move the KC IDE extension out of pre-release. The problem is that trying to install a VSCode extension which depends on a pre-release-only extension will fail to install the dependency with a cryptic error message. Worst case is that I need to implement my own VSCode WASI runtime, or figure out another way to run the assembler inside VSCode (maybe as a regular WASM blob which replaces the C stdlib IO calls with asynchronous functions with completion-callback, delegated to Javascript)
-
Currently, any binary-blob data that needs to be transferred from VSCode into the emulator needs to go through a base64-encoded string which is expensive to encode and decode. The reason for that hack is that transferring Uint8Array objects doesn’t work when VSCode is running in the web (it’s supposed to work, but the data gets corrupted).
-
Working directly on Github repositories in the VSCode web version doesn’t work (weird virtual filesystem issues).
-
…and of course some sort of Language-Server-like editing experience (proper code completion and error squiggles while typing), but without implementing a full-blown language server.